Body Fat Percentage Chart: Healthy Ranges for Men and Women
A practical reference page for understanding body fat percentage ranges, what different categories usually mean, and how to compare chart ranges with BMI, photo estimates, and tape methods.

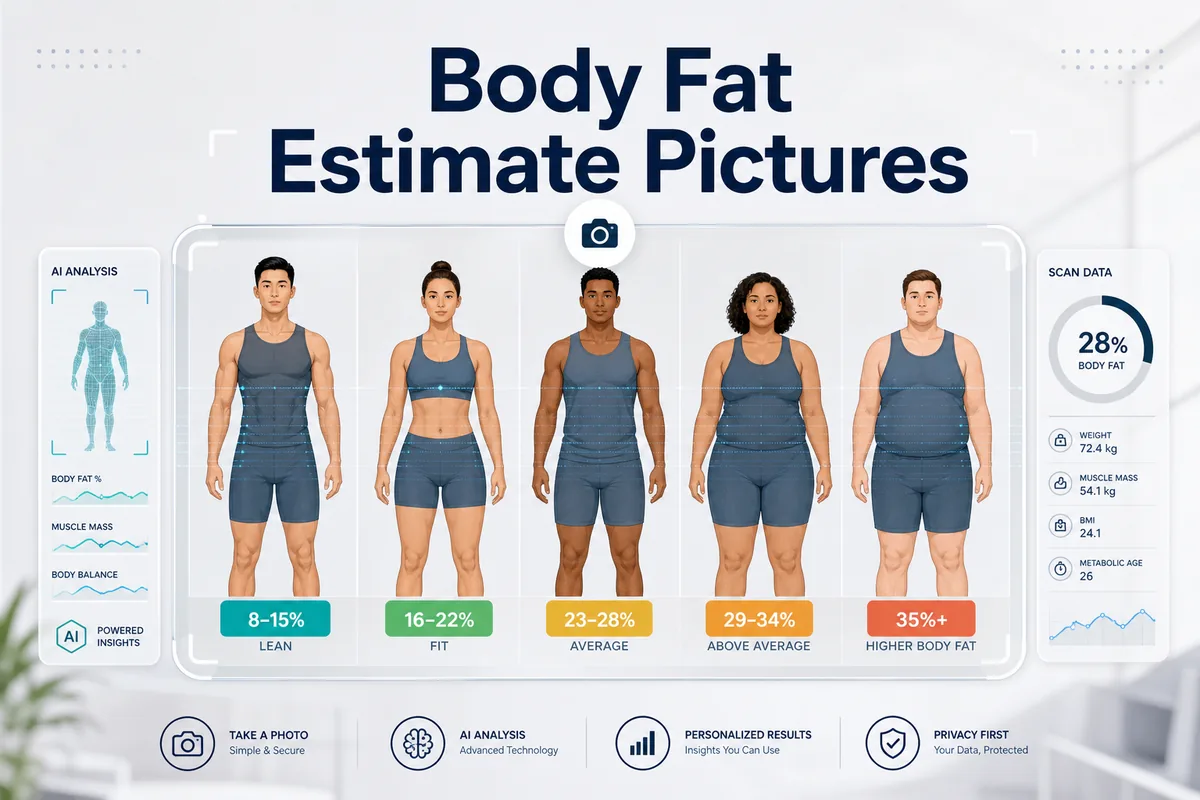
Table of Contents
What a Body Fat Percentage Chart Actually Tells You
A body fat percentage chart groups body fat into practical ranges such as essential fat, athletic, fitness, average, above average, or obesity. People search for it because they want a fast answer to a simple question: what does a certain body fat percentage usually mean in real life?
The chart is useful because scale weight alone cannot show how much of your body is fat tissue versus muscle tissue. A 180-pound person with visible abs and a 180-pound person with little muscle definition can land in very different body fat ranges even if the scale shows the same number.
The limitation is that a chart is still a reference, not a direct measurement. It cannot tell you your exact percentage by itself. You still need an estimate from photos, tape measurements, calipers, or a clinical method. The chart then helps you interpret that estimate in a more useful way.
Best use case
Use a body fat percentage chart to interpret a range you already estimated, not to assign yourself an exact number based on guesswork alone.
Healthy Body Fat Percentage Ranges for Men and Women
Healthy and common body fat ranges are not identical for men and women. Men generally carry less essential fat, while women require a higher minimum level for hormonal and reproductive health. That is why a useful chart always separates the two.
How to think about the categories
- Essential fat: the minimum level needed for normal biological function, not a typical long-term target for most people.
- Athletic and fitness: ranges often associated with visible definition, active training, and lower overall fat storage.
- Average or healthy: a common everyday range where many adults look and function well without extreme leanness.
- Above average and obesity: ranges where visible fat storage is usually higher and health risk may rise depending on other factors.
- Context still matters: age, muscle mass, and fat distribution can change how the same percentage looks on different people.
A healthy body fat percentage is not just the lowest possible number. A realistic healthy range is the one you can maintain while supporting training, recovery, appetite, and long-term health.
Body Fat Percentage Chart for Men and Women
The table below is a practical interpretation guide for common chart categories. It is designed to help users understand what each range usually means rather than treat every category as a strict medical label.
| Range | Men: common meaning | Women: common meaning | How to use the range |
|---|---|---|---|
| Essential fat | About 2-5%, usually too lean for most men to maintain comfortably. | About 10-13%, the lower biological minimum for women. | Understand this as a minimum reference, not a general goal. |
| Athletic | Roughly 6-13% with visible abs and clear muscle definition. | Roughly 14-20% with visible tone and a lean athletic look. | Useful for athletes, physique goals, and image comparisons. |
| Fitness | Around 14-17% with good definition but more sustainable than extreme leanness. | Around 21-24% with a fit appearance and visible tone. | Often a realistic target for active people. |
| Average / healthy | Around 18-24% with less definition but still a common healthy range. | Around 25-31% with natural curves and normal body-fat storage. | A strong baseline reference for most adults. |
| Higher body fat | About 25%+ with softer waist and less visible muscle shape. | About 32%+ with more visible fat storage in common areas. | A screening reference for when lifestyle or health review may help. |
If you want to compare your own appearance with these ranges, use the body fat visualizer. If you want to estimate your body fat from an image first, start with the body fat estimate pictures guide.
How to Read a Body Fat Chart Without Misjudging Yourself
People often misread body fat charts because they assume the chart predicts appearance perfectly. In reality, the chart is broad and appearance varies from person to person.
Do not compare only abs
Waist shape, lower back, arms, hips, thighs, and overall muscle mass all change how a percentage looks.
Do not ignore muscle mass
A muscular person often looks leaner at the same body fat percentage than a person with less muscle.
Do not confuse visual leanness with health by default
The leanest category is not automatically the healthiest or most sustainable category for every person.
Body Fat Chart vs BMI, Photos, Navy Method, and DEXA
A chart tells you how to interpret a result. Other methods help generate the result in the first place. That is why the best body fat workflow usually combines a chart with at least one estimating method.
| Method | Main strength | Main limit | When it helps most |
|---|---|---|---|
| Body fat percentage chart | Easy way to interpret body-fat ranges. | Cannot estimate your percentage by itself. | Understanding what an estimate means. |
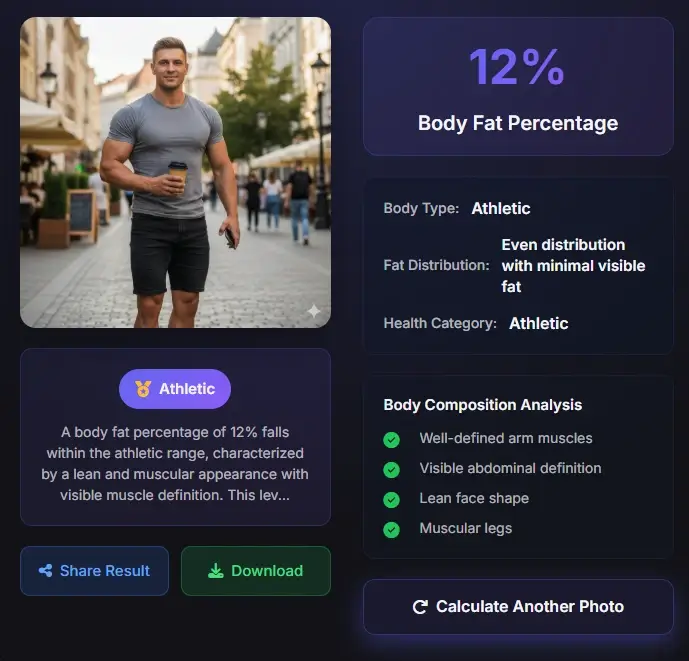
| Photo-based estimate | Useful visual range estimate from a clear photo. | Affected by pose, lighting, clothing, and muscle mass. | Quick visual feedback and progress tracking. |
| BMI | Fast screening from height and weight. | Does not separate fat from muscle. | Basic adult weight-status context. |
| Navy Method | At-home estimate from tape measurements. | Sensitive to where and how you measure. | When you want a non-photo estimate. |
| DEXA | More direct body composition assessment. | Costs more and needs equipment. | When higher accuracy matters. |
Health authorities such as the CDC BMI FAQ explain why BMI alone does not measure body fat. That is exactly where a body fat chart becomes useful: it adds interpretation once you bring in a better body-composition estimate.
Best Way to Use the Chart for Progress Tracking
The chart works best when it supports a repeatable tracking process instead of replacing one.
A simple workflow
- Estimate your body fat with one consistent method, such as a clear photo, AI estimate, or tape measurement.
- Use the chart to translate that estimate into a realistic category and range.
- Track changes every 2-4 weeks instead of chasing daily fluctuations.
- Compare your result with waist size, scale weight, training performance, and how your clothes fit.
- Review trends over months, not one isolated reading.
If you want the fastest next step, try the AI body fat calculator. If the chart makes you wonder how the range looks on real bodies, continue with the body fat visualizer guide.
FAQ About Body Fat Percentage Charts
What is a healthy body fat percentage?
It depends on sex, age, and context. For many adults, healthy ranges often overlap with roughly 18-24% for men and 25-31% for women, but goals vary.
Is the lowest body fat range the healthiest?
Not always. Essential or extremely lean ranges can be difficult to maintain and are not the best long-term target for most people.
Why do two people at the same body fat percentage look different?
Muscle mass, fat distribution, frame size, posture, and lighting can all change visual appearance at the same percentage.
Is a body fat chart better than BMI?
They do different jobs. BMI screens weight status, while a body fat chart helps interpret body-composition estimates more directly.
What is the best way to estimate body fat before using the chart?
A consistent photo-based estimate, the Navy tape method, calipers, or a clinical method such as DEXA can all be used. The chart then helps you understand the result.
Does a body fat percentage chart change by age?
Age can affect what is typical, but a chart should not be read as a diagnosis or a single universal target. Use sex-specific ranges, health context, measurement method, and changes over time together.
Final takeaway
A body fat percentage chart is most useful as an interpretation tool. Use it to understand a range, compare realistic goals, and track long-term changes instead of treating it as an exact measurement by itself.
Sources and Further Reading
- CDC BMI Frequently Asked Questions - BMI use and limitations.
- American Council on Exercise: Body Fat Percentage Chart - General body-fat percentage category context.
- Cleveland Clinic: DXA Scan - Overview of DXA scanning.