BMI Chart for Adults: Categories, Ranges, and Healthy BMI
Use the chart to find an adult BMI category quickly, then read the age, muscle, ethnicity, and body-fat limits that make the number useful only as one part of a health picture.

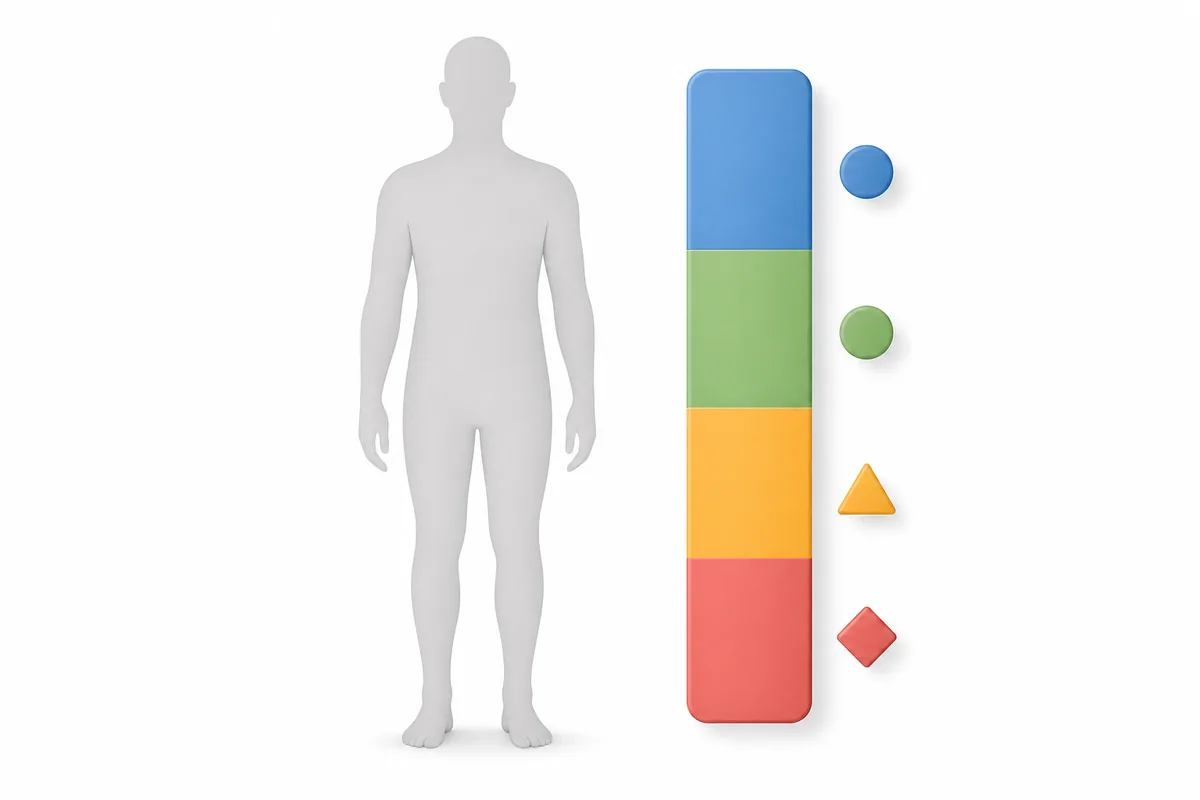
Table of Contents
What the Adult BMI Chart Shows
A BMI chart maps a calculated body mass index to broad adult categories. It is useful when you want a quick, consistent way to describe weight relative to height, especially when comparing a measurement over time or deciding what question to discuss with a clinician.
The standard adult chart is usually intended for people age 20 and older. It does not directly measure body fat, muscle, bone, waist size, fitness, or where fat is stored. Two people with the same BMI can therefore have very different body compositions and health risks.
The ranges below are the commonly used adult cutoffs reported by major health organizations in the United States. Other countries, clinical services, or population-specific guidance may use additional thresholds, so treat the chart as a general reference rather than a universal rule.
Use the category as a starting point
A BMI category can flag a reason to look closer, but it cannot tell you what caused the number or what action is right for you. Combine it with waist measurements, medical history, activity, body-fat context, and trends.
Adult BMI Chart and Category Ranges
Find your calculated BMI in the first column, then read the category and the practical meaning in the next columns. The category names are labels used for population screening; they are not judgments about appearance, character, or personal worth.
A value close to a boundary should not be treated as a sudden change in health. Rounding, scale accuracy, height measurement, hydration, and the choice of reference standard can move a result slightly. If a result is near a cutoff, repeat the measurement consistently and consider the wider context.
| BMI range | Category | How to interpret it |
|---|---|---|
| Below 18.5 | Underweight | May be associated with low body mass, but the reason can range from natural build to nutrition or health issues. |
| 18.5–24.9 | Healthy weight | A commonly used reference range for adults; it does not guarantee good health or describe body composition. |
| 25.0–29.9 | Overweight | A screening range above the standard reference; muscle mass and waist size can change the interpretation. |
| 30.0–34.9 | Obesity class 1 | A higher screening range that may justify a broader health review rather than a conclusion from BMI alone. |
| 35.0–39.9 | Obesity class 2 | A higher BMI range; discuss the result with a qualified professional if it concerns you. |
| 40.0 or higher | Obesity class 3 | A very high screening range that should be interpreted with individual medical context and support. |
The chart is not designed to diagnose an eating disorder, determine an ideal appearance, or set a single target weight. It is a starting point for a more complete conversation.
How to Read a BMI Range
Start with the exact BMI value, not only the category word. A BMI of 24.9 and 25.0 fall on opposite sides of a conventional boundary even though the practical difference is tiny. This is why repeated measurements and long-term direction are often more useful than reacting to one decimal place.
Next, ask whether the adult chart fits the person being measured. Children and teenagers need BMI-for-age percentiles, and pregnancy requires different clinical interpretation. A very muscular athlete, an older adult with low muscle mass, or someone with a different population risk profile may need additional measures.
Finally, connect the number to the question you are actually trying to answer. If you want to track weight change, use the same scale and method. If you want to understand body composition, add waist or body-fat information. If you are worried about symptoms or unplanned weight change, seek medical advice instead of trying to diagnose yourself with a chart.
What common values mean
- BMI 20: Usually falls inside the commonly used healthy-weight range for adults, but it does not prove that nutrition, muscle, or health status is ideal.
- BMI 25: Sits at the conventional start of the overweight range. It is a boundary value, not a meaningful before-and-after health verdict.
- BMI 30: Sits at the conventional start of the obesity range. The result deserves context and support, not shame or a rushed plan.
BMI Formula and a Worked Example
BMI uses weight and height only. Convert weight to kilograms and height to meters before calculating. If you use pounds and inches, an imperial version of the formula multiplies weight by 703 and divides by height in inches squared; a calculator can handle the conversion for you.
The formula is intentionally simple, which makes BMI easy to compare across large groups. That simplicity is also why it cannot separate fat from muscle or show where fat is located. Use the formula to reproduce the number, then use the chart carefully.
Metric formula
BMI = weight (kg) ÷ height (m)²
Example: 70 kg ÷ (1.75 m × 1.75 m) = BMI 22.9, which falls in the commonly used healthy-weight category for adults.
Do Men and Women Use the Same BMI Chart?
For most adult screening charts, men and women use the same BMI category cutoffs. BMI already uses height and weight, so the standard adult table does not create separate male and female ranges. That does not mean the same BMI has the same body-fat percentage or health meaning for every person.
Sex, age, ethnicity, muscle mass, menopause status, pregnancy, and fat distribution can all affect the context. A BMI chart should therefore be paired with the measures that match your reason for checking it.
When the standard adult chart needs extra context
- Under 20: Use BMI-for-age growth references that account for age and sex rather than applying the adult table directly.
- Pregnancy: Ask a prenatal clinician how to interpret weight change; an adult BMI chart is not a pregnancy assessment tool.
- High muscle mass: Strength training can raise body weight without the same increase in body fat, so waist or body-composition data may be more informative.
- Different population risks: Some guidelines use lower or additional thresholds for certain ethnic groups because metabolic risk can occur at different BMI levels.
Age, Muscle, Ethnicity, and Other BMI Chart Limits
BMI is a screening measure, not a diagnostic test. The most useful way to read a BMI chart is to know what it leaves out and choose a complementary measure when the missing information matters.
| Factor | Why it matters | Better next step |
|---|---|---|
| Muscle mass | Muscle is denser than fat, so a muscular person may have a high BMI without the same body-fat pattern. | Add waist, body-fat, performance, and clinician context. |
| Fat distribution | BMI cannot show whether fat is concentrated around the abdomen or distributed elsewhere. | Track waist circumference consistently when appropriate. |
| Age and growth | Children, teens, and older adults can need different reference methods or additional measures. | Use age-specific guidance and professional interpretation. |
| Ethnicity and population | Metabolic risk is not identical across all populations at the same BMI. | Use local or clinical thresholds when they are recommended. |
| Pregnancy or illness | Pregnancy, edema, illness, and unplanned weight change can make a simple ratio misleading. | Ask a qualified healthcare professional. |
Do not use a BMI chart to diagnose yourself, change medication, or set an extreme diet. If weight changes suddenly or you have symptoms, discuss them with a healthcare professional.
BMI Chart vs Body Fat Percentage
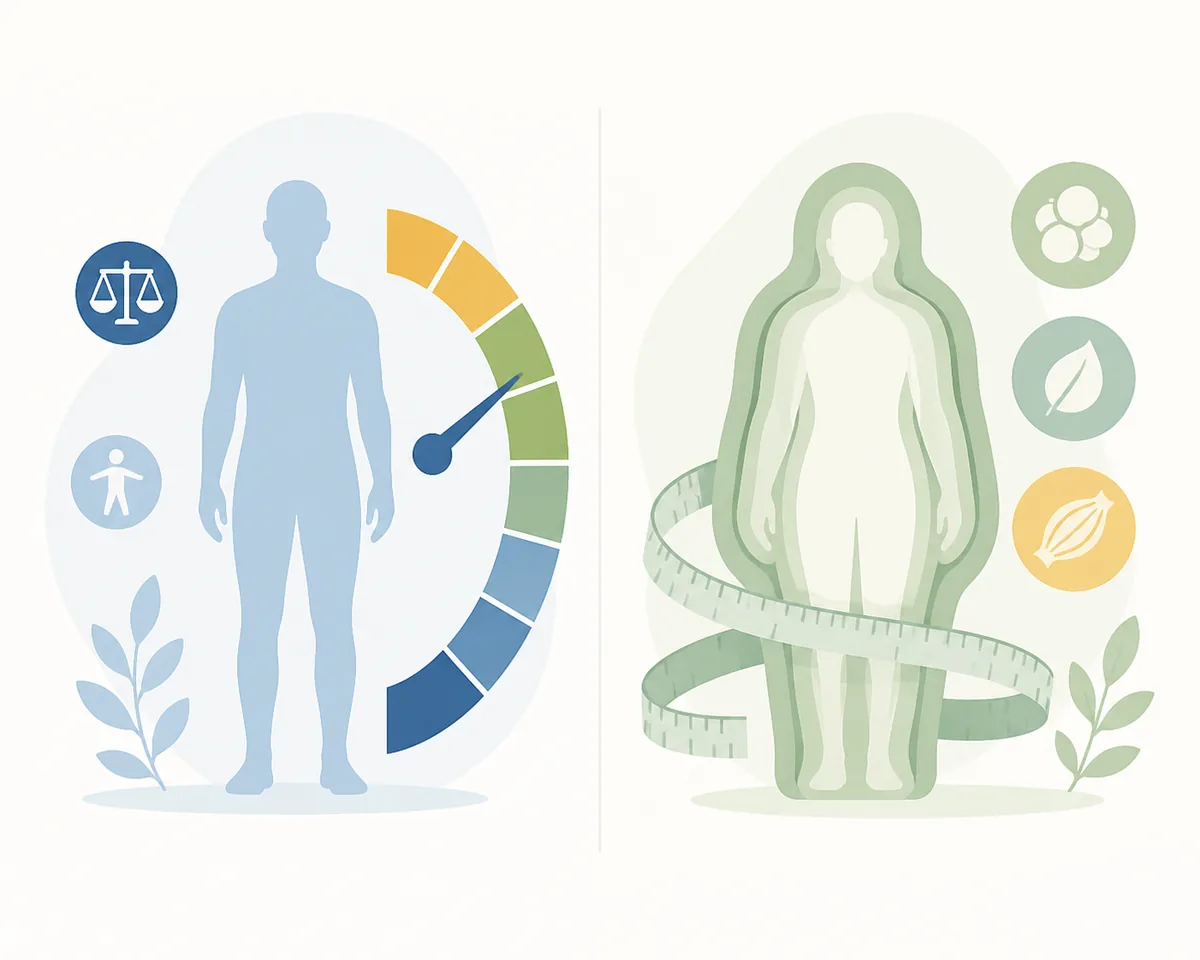
BMI and body-fat percentage answer different questions. BMI describes weight relative to height; body-fat percentage estimates how much of that weight is fat. Neither measure is perfect, and both depend on the quality of the measurement and the context in which you use it.
For someone who wants a broader body-composition picture, compare a BMI result with a consistent waist measurement, a repeatable body-fat method, activity level, blood pressure, laboratory data when relevant, and how the trend changes over time. A single number should not replace a complete health assessment.
- BMI chart: Fast, inexpensive, and easy to reproduce; best for broad screening and trend conversations.
- Body-fat estimate: Adds composition context, but tape, BIA, calipers, photos, and clinical methods have different error patterns.
- Best practical use: Use the BMI chart to orient yourself, then choose the next measure that answers your real question without overreacting to a category.
BMI Chart FAQ
What is a normal BMI range for adults?
The commonly used adult reference range is 18.5 to 24.9. It is often called the healthy-weight range, but it does not guarantee health and should be interpreted with age, muscle, waist size, and medical context.
Do men and women have the same BMI chart?
Most adult screening charts use the same BMI cutoffs for men and women. The same BMI can still correspond to different body-fat percentages and risk patterns, so sex and body composition remain important context.
Is a BMI of 25 overweight?
A BMI of 25.0 is conventionally at the start of the overweight category. Because it is a boundary value, do not treat it as a sudden change in health; review the measurement and the wider context.
Can I use the adult BMI chart for a child or teenager?
No. People under 20 generally need BMI-for-age percentiles that account for age and sex. Ask a pediatric professional or use an age-specific reference rather than applying adult cutoffs.
Is BMI better than body-fat percentage?
Neither is universally better. BMI is simpler and more repeatable for broad screening, while body-fat percentage can add composition information but varies by method. Use the measure that fits the question and track it consistently.
Where can I calculate my BMI?
Use the BMI calculator on Am I Fat for a quick height-and-weight calculation, then return to this chart to interpret the category and its limits.
The practical takeaway
A BMI chart is most useful when it starts a better question: what does this number mean for this person, measured this way, at this age, and alongside which other health signals? Use the category as context, not as a verdict.
Sources and Further Reading
- CDC: Adult BMI Categories — Common adult BMI categories and the distinction between screening and diagnosis.
- NHLBI: BMI Table — Adult BMI ranges used in weight-management education.
- World Health Organization: Body Mass Index — Background on BMI as a population and health measure, including interpretation limits.